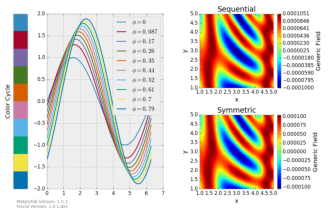
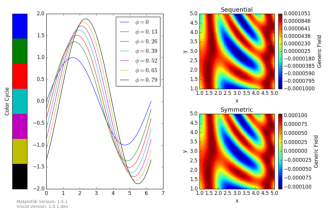
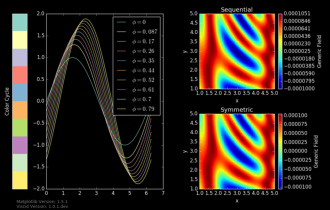
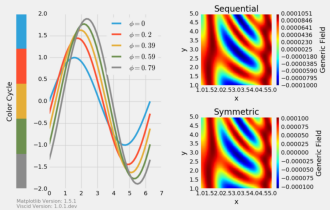
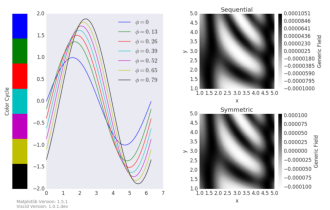
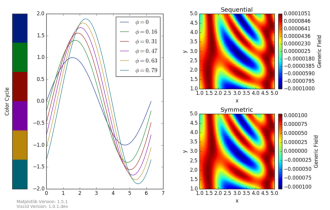
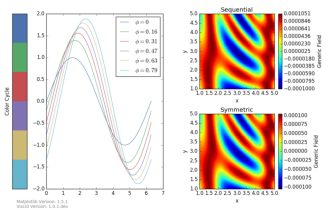
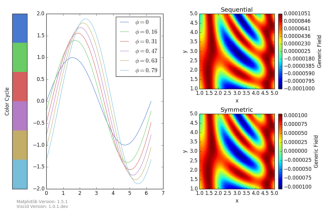
Matplotlib Style Gallery
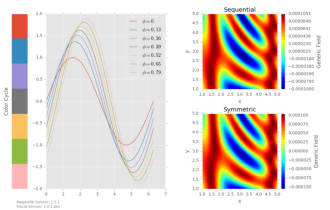
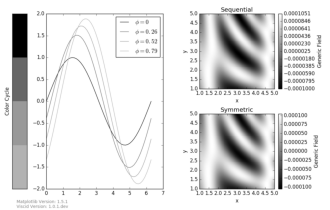
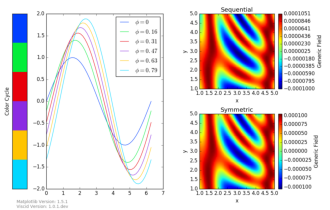
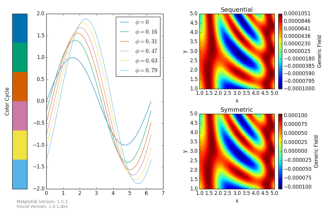
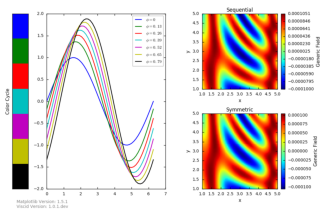
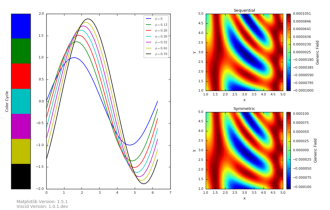
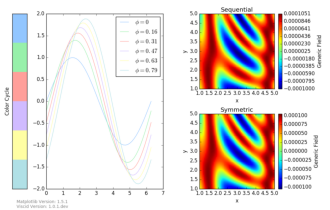
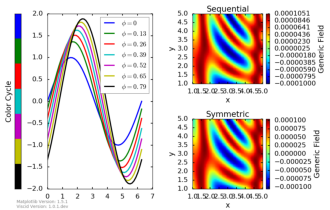
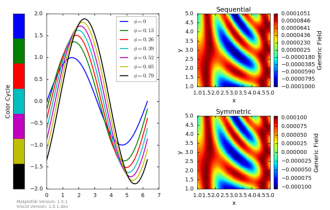
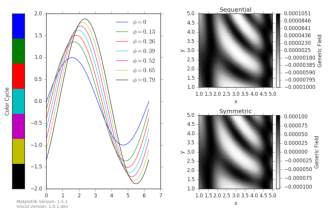
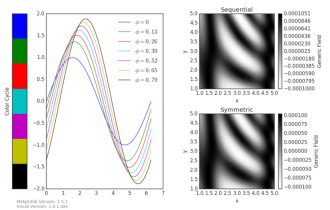
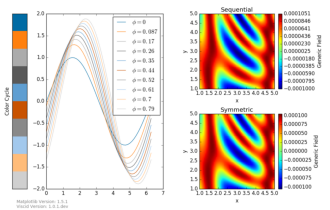
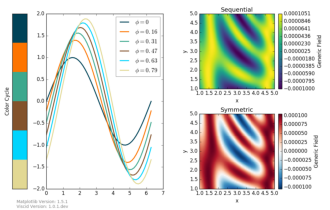
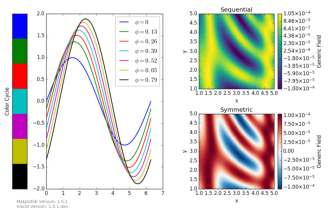
If you have Matplotlib 1.5 or higher, you really should use a style sheet for your plots. They are very easy to use as explained here. The gallery below summarizes all the styles provided by the recent versions of Matplotlib and Viscid. A default set of style sheets can be loaded using a viscidrc file as explained in Custom Behavior (rc file).