Plotting Scalar Quantities
The basic idea of Viscid is to convert data files to viscid.field.Field objects and pass them to a convenience function for plotting. It is useful to note that Field objects have most of the same functionality as Numpy’s ndarrays. That is, you can do simple math with Numpy using:
field_momentum = field_density * field_velocity
Various shims for plotting fields using matplotlib are provided by viscid.plot.vpyplot. The functions are listed in Useful Functions. For an enumeration of extra plotting keyword arguments, see Plot Options. Also, you can specify keyword arguments that are conusmed by the matplotlib function used to make the plot, i.e., pyplot.pcolormesh, pyplot.contourf, etc.
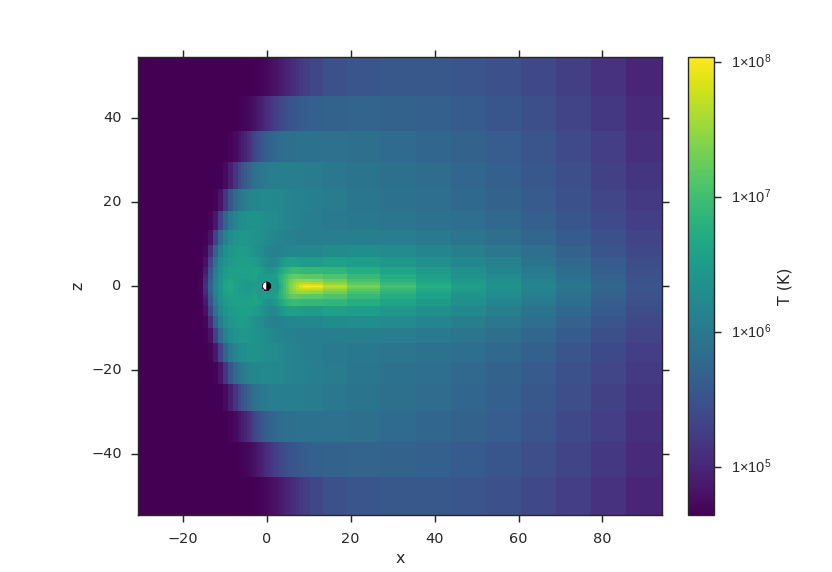
Plotting Temperature
Here, we just open up an OpenGGCM xdmf file and plot the Temperature with a log scale. For a better idea of the different plotting options, refer to Plot Options.
from os import path

import viscid
from viscid.plot import vpyplot as vlt


f3d = viscid.load_file(path.join(viscid.sample_dir, 'sample_xdmf.3d.xdmf'))

pPa_to_dyne_per_cm2 = 1e-11
erg_to_K = (1.380e-16)**-1
fac = (2.0 / 3.0) * erg_to_K * pPa_to_dyne_per_cm2

T = fac * f3d["pp"] / f3d["rr"]
T.name = "T"
T.pretty_name = "T (K)"

vlt.plot(T['y=0j'], logscale=True, earth=True)

vlt.show()
(Source code, png)
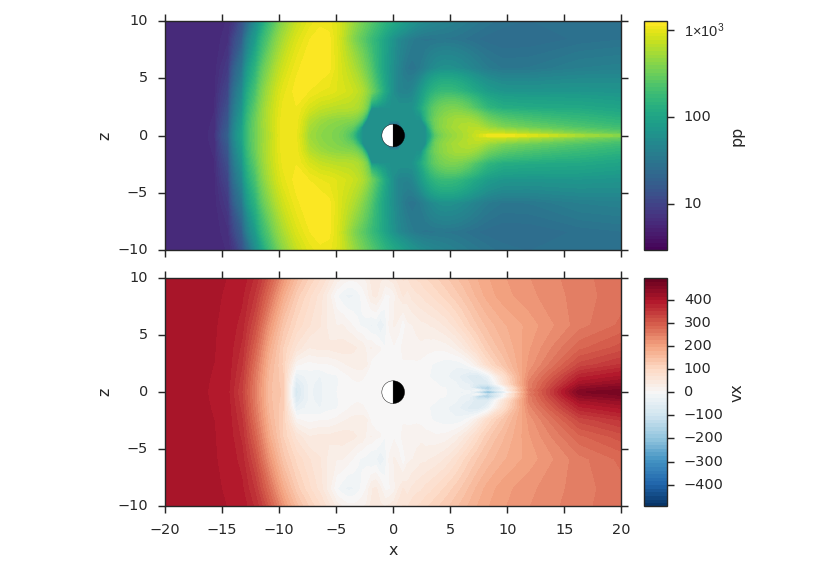
Two Plots, One Figure
from os import path

import viscid
from viscid.plot import vpyplot as vlt
from matplotlib import pyplot as plt


f3d = viscid.load_file(path.join(viscid.sample_dir, 'sample_xdmf.3d.xdmf'))

fig, axes = plt.subplots(2, 1, sharex=True, sharey=True)

# plot pressure with 64 contours on a logscale
vlt.plot(f3d["pp"]["y=0.0j"], style="contourf", levels=64,
         plot_opts="log, earth", ax=axes[0])

# plot velocity in x with a colorbar symmetric about 0
# also, share axes so this plot pans/zooms with the first
vlt.plot(f3d["vx"]["y=0.0j"], style="contourf", levels=64,
         lin=0, earth=True, ax=axes[1])

plt.xlim((-20, 20))
plt.ylim((-10, 10))

vlt.auto_adjust_subplots()

vlt.show()
(Source code, png)