Ionosphere Plots
from os import path
import viscid
from viscid import sample_dir
from viscid.plot import vpyplot as vlt
from matplotlib import pyplot as plt
iono_file = viscid.load_file(path.join(sample_dir, 'sample_xdmf.iof.xdmf'))
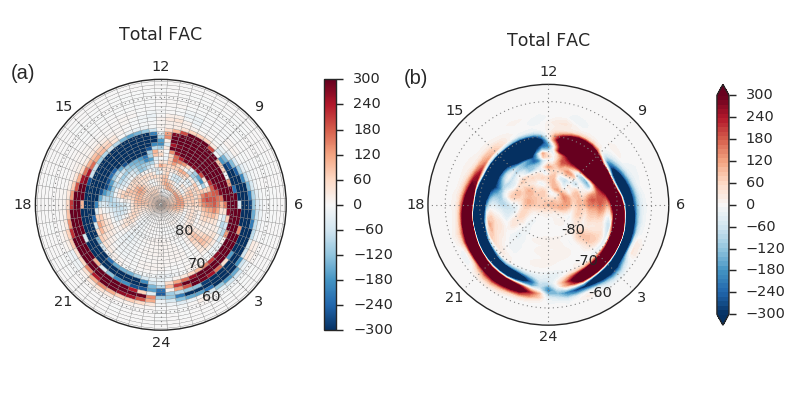
fac_tot = 1e9 * iono_file["fac_tot"]
plot_args = dict(projection="polar",
lin=[-300, 300],
bounding_lat=35.0,
drawcoastlines=True, # for basemap only, probably will never be used
title="Total FAC\n", # make a title, or if a string, use the string as title
gridec='gray',
label_lat=True,
label_mlt=True,
colorbar=True,
cbar_kwargs=dict(pad=0.15) # pad the colorbar away from the plot
)
_, (ax0, ax1) = plt.subplots(1, 2, subplot_kw=dict(projection='polar'))
vlt.plot(fac_tot, ax=ax0, hemisphere='north', **plot_args)
ax0.annotate('(a)', xy=(0, 0), textcoords="axes fraction",
xytext=(-0.1, 1.0), fontsize=18)
plot_args['gridec'] = False
vlt.plot(fac_tot, ax=ax1, hemisphere="south", style="contourf",
levels=50, extend="both", **plot_args)
ax1.annotate('(b)', xy=(0, 0), textcoords="axes fraction",
xytext=(-0.1, 1.0), fontsize=18)
plt.gcf().set_size_inches(10, 5.0)
vlt.auto_adjust_subplots()
vlt.show()
(Source code, png)
