#!/usr/bin/env python
"""Test calculating a quasipotential
This amounts to calculating streamlines and interpolating a field onto
those lines.
"""
from __future__ import print_function
import argparse
import sys
from viscid_test_common import next_plot_fname, xfail
import numpy as np
import viscid
from viscid import vutil
from viscid.plot import vpyplot as vlt
def make_arcade(eps, xl=(-10.0, 0.0, -10.0), xh=(10.0, 20.0, 10.0),
L=(5, 5, 5), N=(32, 32, 32), layout='interlaced'):
xl, xh = np.asarray(xl), np.asarray(xh)
x = np.linspace(xl[0], xh[0], N[0])
y = np.linspace(xl[1], xh[1], N[1])
z = np.linspace(xl[2], xh[2], N[2])
b = viscid.zeros([x, y, z], nr_comps=3, layout=layout)
e = viscid.zeros_like(b)
X, Y, Z = b.get_crds('xyz', shaped=True)
Y2 = Y**2 / L[1]**2
Z2 = Z**2 / L[2]**2
b['x'] = -1 - (eps * ((1 - Y2) / (1 + Y2)) * (1 / (1 + Z2)))
b['y'] = X
b['z'] = 0.2
e['z'] = Y / ((1 + Y2) * (1 + Z2))
return b, e
def _main():
parser = argparse.ArgumentParser(description=__doc__)
parser.add_argument("--show", "--plot", action="store_true")
args = vutil.common_argparse(parser)
b, e = make_arcade(8.0, N=[64, 64, 64])
epar = viscid.project(e, b)
epar.pretty_name = "E parallel"
###############
# Calculate Xi
seeds = viscid.Volume(xl=[-10, 0.0, -10], xh=[10, 0.0, 10],
n=[64, 1, 64])
b_lines, _ = viscid.calc_streamlines(b, seeds)
xi_dat = viscid.integrate_along_lines(b_lines, e, reduction='dot')
xi = seeds.wrap_field(xi_dat, name='xi', pretty_name=r"$\Xi$")
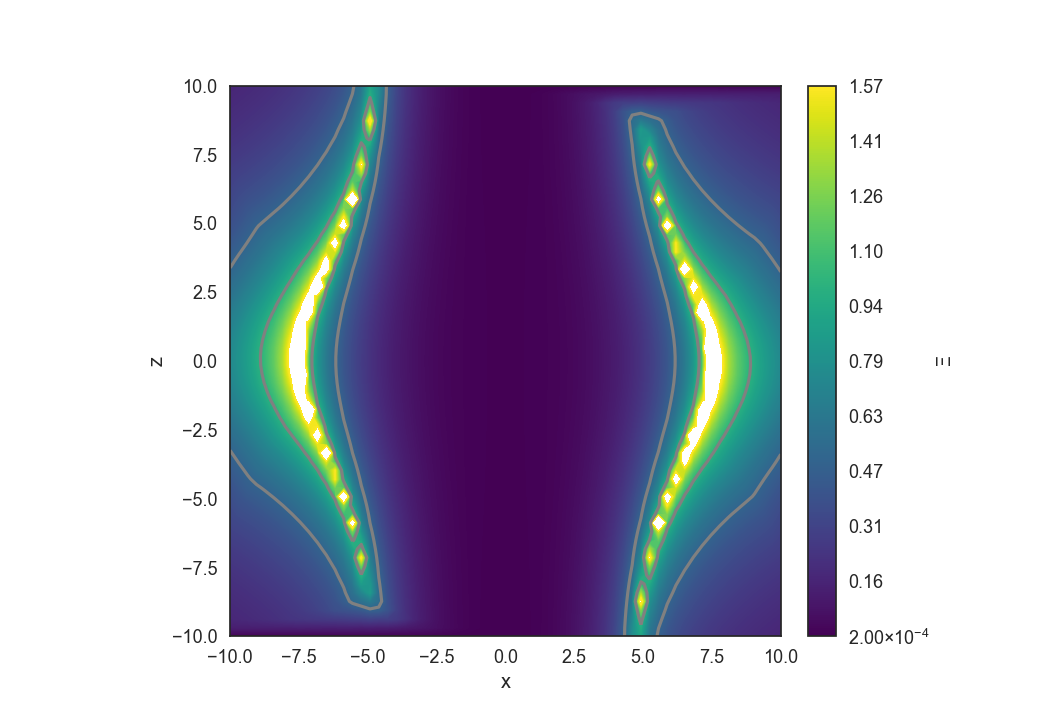
################################
# Make 2D Matplotlib plot of Xi
vlt.plot(xi, x=(-10, 10), y=(-10, 10), style='contourf', levels=256,
lin=(2e-4, 1.5718))
vlt.plot(xi, x=(-10, 10), y=(-10, 10), style='contour', colors='grey',
levels=[0.5, 1.0])
vlt.savefig(next_plot_fname(__file__))
if args.show:
vlt.show()
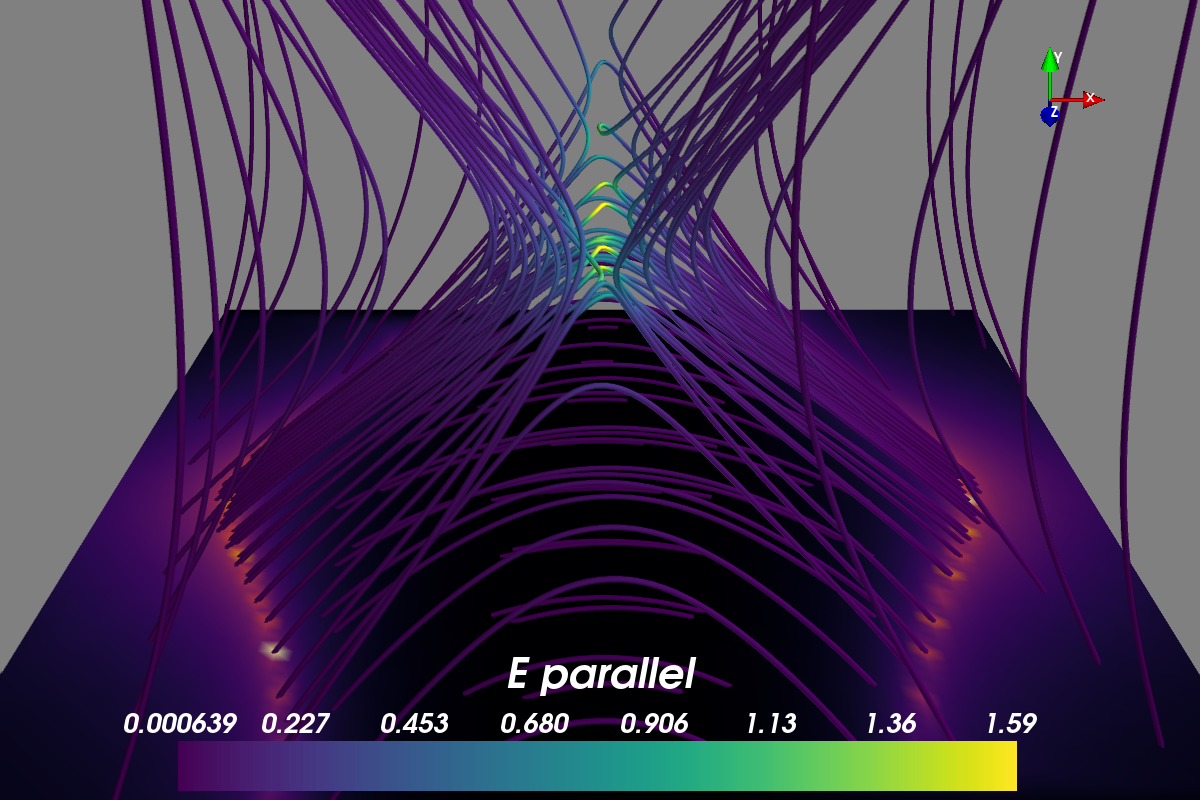
############################################################
# Make 3D mayavi plot of Xi and the 'brightest' field lines
# as well as some other field lines for context
try:
from viscid.plot import vlab
except ImportError:
xfail("Mayavi not installed")
vlab.mlab.options.offscreen = not args.show
vlab.figure(size=[1200, 800])
inds = np.argsort(xi_dat)[-64:]
inds = np.concatenate([inds, np.arange(len(xi_dat))[::71]])
s = vlab.plot_lines(b_lines[inds], scalars=epar, cmap='viridis')
vlab.mesh_from_seeds(seeds, scalars=xi, cmap='inferno')
vlab.colorbar(s, orientation='horizontal', title=epar.pretty_name)
# vlab.streamline(b, scalars=e, seedtype='sphere', seed_resolution=4,
# integration_direction='both')
oa = vlab.orientation_axes()
oa.marker.set_viewport(0.75, 0.75, 1.0, 1.0)
vlab.view(roll=0, azimuth=90, elevation=25, distance=30.0,
focalpoint=[0, 2, 0])
vlab.savefig(next_plot_fname(__file__))
if args.show:
vlab.show()
try:
vlab.mlab.close()
except AttributeError:
pass
return 0
if __name__ == "__main__":
sys.exit(_main())
##
## EOF
##