OpenGGCM Examples
GSE coordinates
This is just one way to customize the OpenGGCM reader. For more, check out viscid.readers.openggcm.GGCMGrid.
from os import path
import viscid
from viscid.plot import vpyplot as vlt
from matplotlib import pyplot as plt
viscid.readers.openggcm.GGCMFile.read_log_file = True
viscid.readers.openggcm.GGCMGrid.mhd_to_gse_on_read = 'auto'
f3d = viscid.load_file(path.join(viscid.sample_dir, 'sample_xdmf.3d.xdmf'))
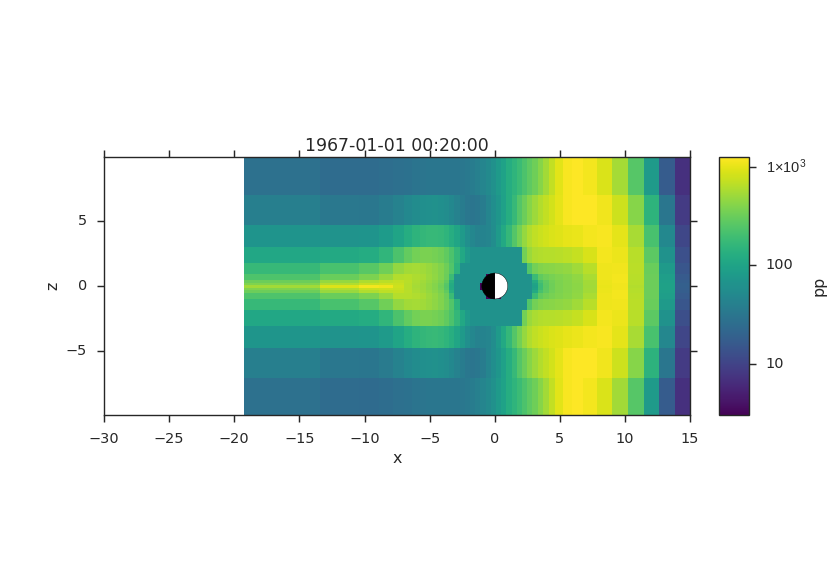
pp = f3d["pp"]["x = -20.0j:20.0j, y = 0.0j, z = -10.0j:10.0j"]
vlt.plot(pp, plot_opts="log,x_-30_15", earth=True)
plt.title(pp.format_time("UT"))
vlt.show()
(Source code, png)
Time Series
from os import path
import matplotlib.dates as mdates
import numpy as np
import viscid
from viscid.plot import vpyplot as vlt
from matplotlib import pyplot as plt
viscid.readers.openggcm.GGCMFile.read_log_file = True
viscid.readers.openggcm.GGCMGrid.mhd_to_gse_on_read = 'auto'
f2d = viscid.load_file(path.join(viscid.sample_dir, 'sample_xdmf.py_0.xdmf'))
ntimes = f2d.nr_times()
t = [None] * ntimes
pressure = np.zeros((ntimes,), dtype='f4')
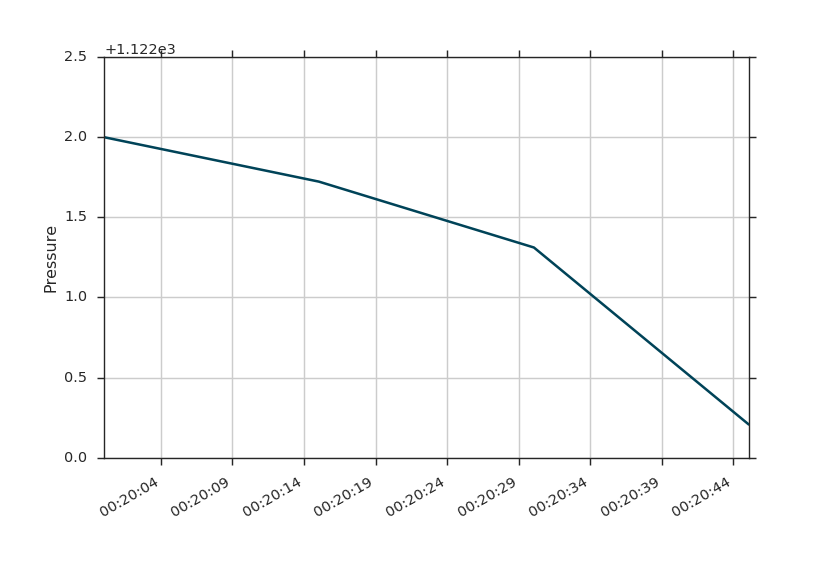
for i, grid in enumerate(f2d.iter_times()):
t[i] = grid.time_as_datetime()
pressure[i] = grid['pp']['x=10.0j, y=0.0j, z=0.0j']
plt.plot(t, pressure)
plt.ylabel('Pressure')
dateFmt = mdates.DateFormatter('%H:%M:%S')
# dateFmt = mdates.DateFormatter('%Y-%m-%d %H:%M:%S')
plt.gca().xaxis.set_major_formatter(dateFmt)
plt.gcf().autofmt_xdate()
plt.gca().grid(True)
plt.show()
(Source code, png)
