Style: seaborn-whitegrid
Style Sheet
Note that this is not the same syntax as the original style sheet.
axes.axisbelow: True
axes.edgecolor: .8
axes.facecolor: white
axes.grid: True
axes.labelcolor: .15
axes.linewidth: 1.0
figure.facecolor: white
font.family: [sans-serif]
font.sans-serif: [Arial, Liberation Sans, Bitstream Vera Sans, sans-
                 serif]
grid.color: .8
grid.linestyle: -
image.cmap: Greys
legend.frameon: False
legend.numpoints: 1
legend.scatterpoints: 1
lines.solid_capstyle: round
text.color: .15
xtick.color: .15
xtick.direction: out
xtick.major.size: 0.0
xtick.minor.size: 0.0
ytick.color: .15
ytick.direction: out
ytick.major.size: 0.0
ytick.minor.size: 0.0
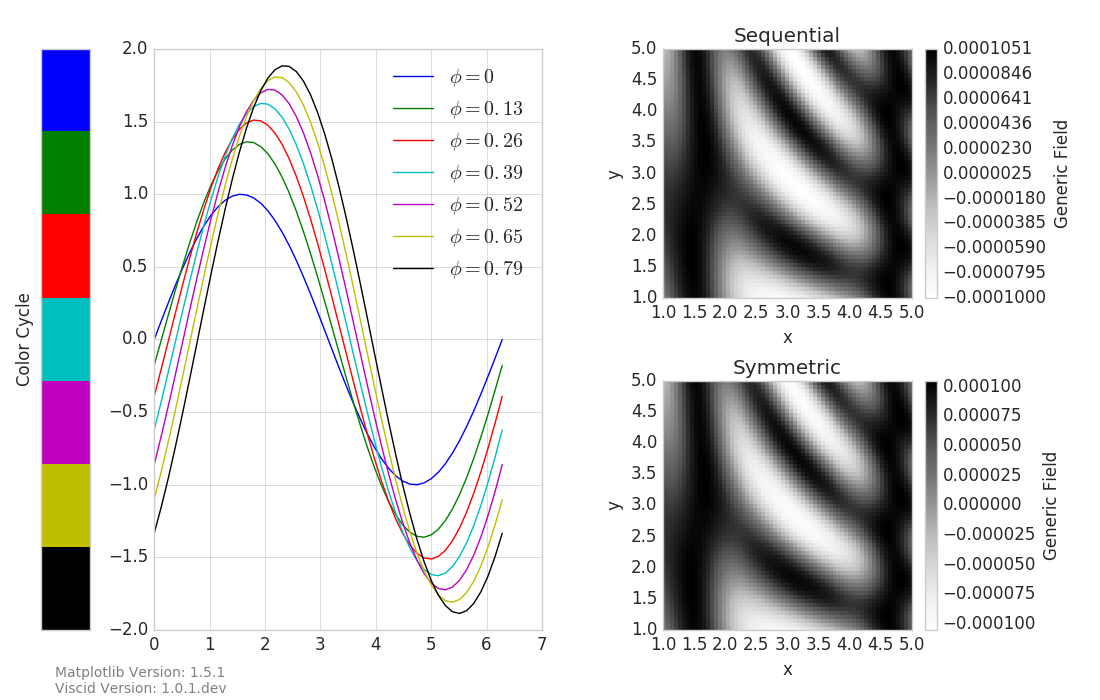
Example Source Code
import matplotlib
from matplotlib.colors import ListedColormap
import numpy as np
import viscid
from viscid.plot import vpyplot as vlt
import matplotlib.pyplot as plt

matplotlib.rcParams.update(matplotlib.rcParamsDefault)

fld = viscid.empty((np.linspace(1, 5, 64), np.linspace(1, 5, 64)),
                   name="F", pretty_name="Generic Field")
X, Y = fld.get_crds(shaped=True)
fld[:, :] = 1e-4 * (np.sin(X)**10 + np.cos(10 + X * Y) * np.cos(X))

with plt.style.context(("seaborn-whitegrid",)):
    fig = plt.figure(figsize=(11, 7))

    ax = plt.subplot2grid((2, 9), (0, 0), rowspan=2)
    pal = vlt.get_current_colorcycle()
    size = 1
    n = len(pal)
    ax.imshow(np.arange(n).reshape(n, 1), cmap=ListedColormap(list(pal)),
              interpolation="nearest", aspect="auto")
    ax.set_xticks([])
    ax.set_yticks([])
    ax.set_xticklabels([])
    ax.set_yticklabels([])
    ax.set_ylabel("Color Cycle")

    plt.subplot2grid((2, 9), (0, 1), rowspan=2, colspan=4)
    x = np.linspace(0, 2 * np.pi)
    for phase in np.linspace(0, np.pi / 4, n):
        plt.plot(x, (1 + np.sqrt(phase)) * np.sin(x - phase),
                     label=r"$\phi = {0:.2g}$".format(phase))
    plt.legend(loc=0)

    plt.subplot2grid((2, 9), (0, 5), colspan=4)
    vlt.plot(fld)
    plt.title("Sequential")

    plt.subplot2grid((2, 9), (1, 5), colspan=4)
    vlt.plot(fld, lin=0)
    plt.title("Symmetric")

    vlt.auto_adjust_subplots(subplot_params=dict(top=0.93, bottom=0.1))
    txt = ("Matplotlib Version: {0}\nViscid Version: {1}"
           "".format(matplotlib.__version__, viscid.__version__))
    fig.text(0.05, 0.01, txt, color='grey', size='small')